
Quarterly KPI report template
An 11-slide quarterly report for a board: a scorecard, then growth, adoption, service, retention and cash, each chart with a one-line takeaway. The charts are PowerPoint charts you can edit.

- Slides
- 11 slides, 16:9
- Category
- Business reports
- Edit and export as
- PowerPoint (.pptx), Keynote (.key), PDF, PNG, web page (.html), Google Slides
Good for
- Reporting metrics against targets
- Charts that each need a one-line takeaway
Or have your own agent start from it:
$ dock slides create "Quarterly KPI report" --template g6-kpi-report Set up Dock MCP What's on each slide
The names and numbers on the slides are sample content. Dock replaces them with yours.
Cover with the period, a large stacked title and a subtitle
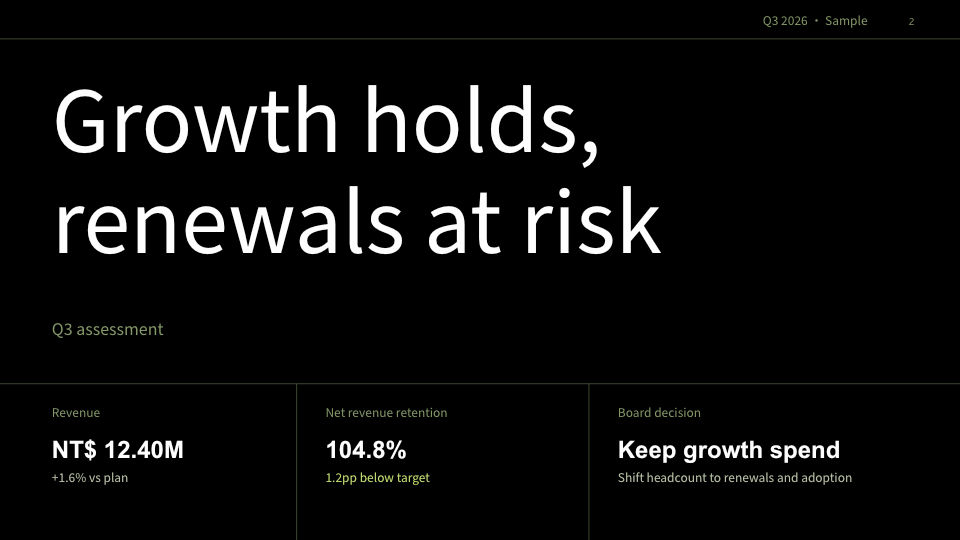
Dark headline slide with three key figures
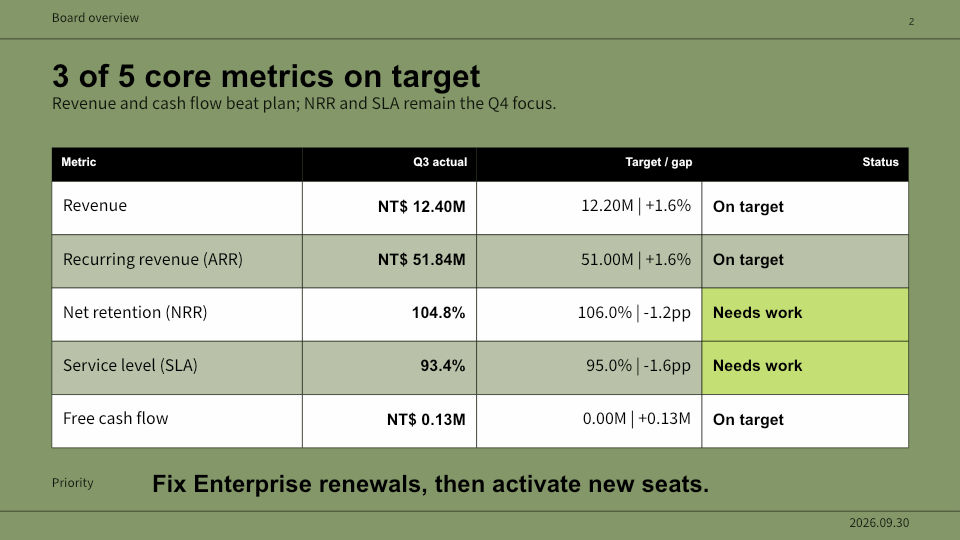
Scorecard table: metric, actual, target and status
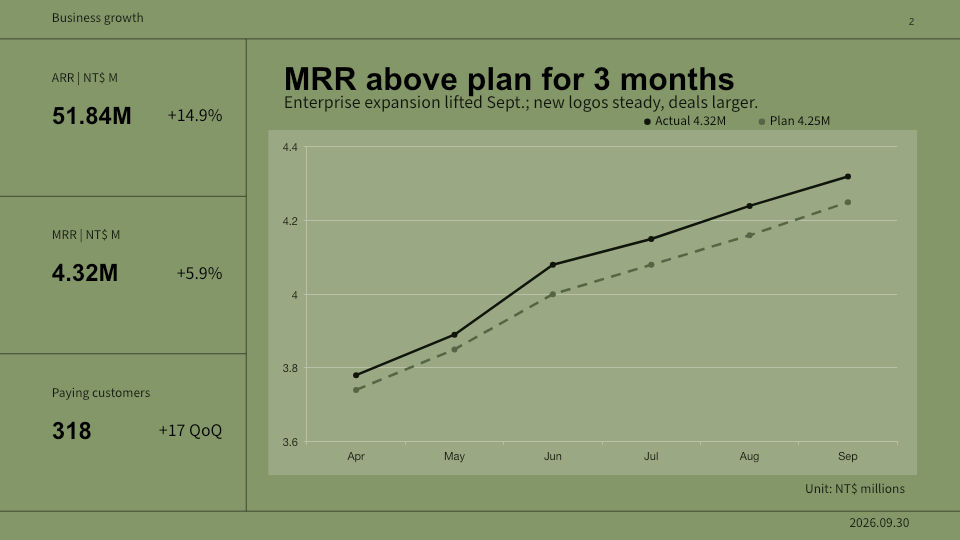
Three KPIs beside a line chart against plan
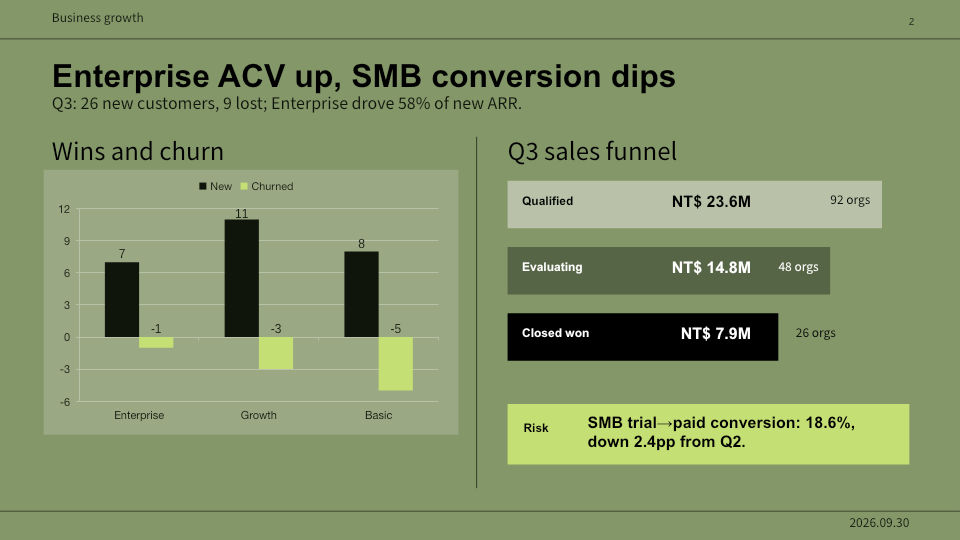
Column chart beside a three-step funnel and a risk callout
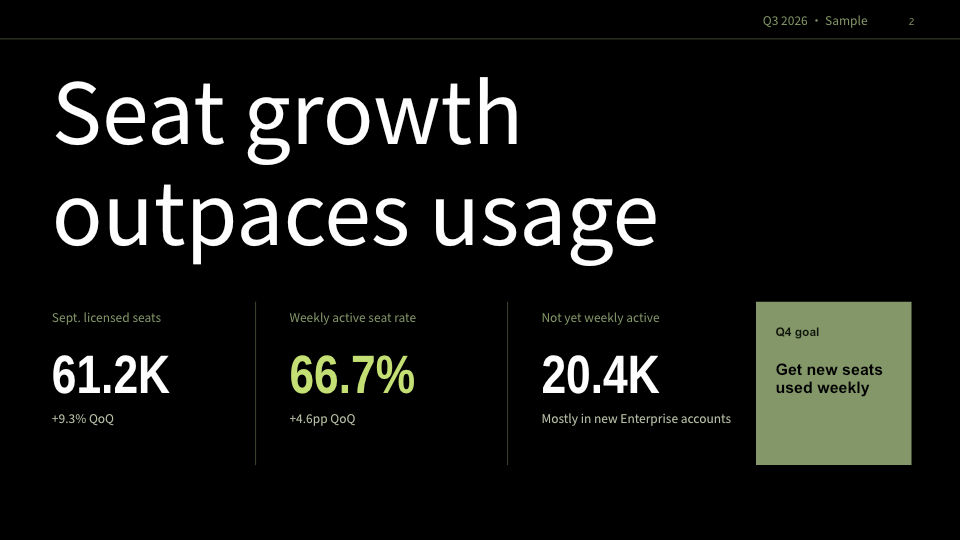
Dark headline slide with three figures and a task card
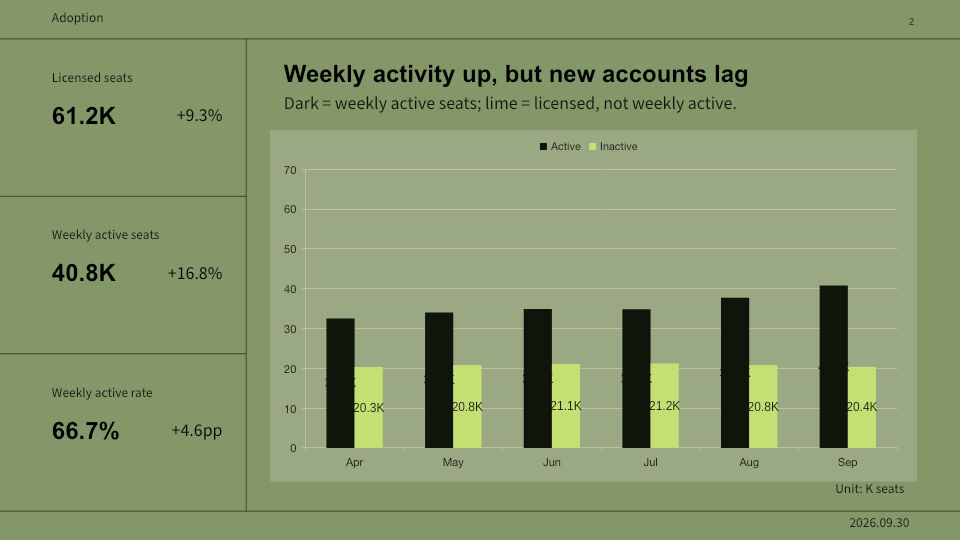
Three KPIs beside a paired column chart
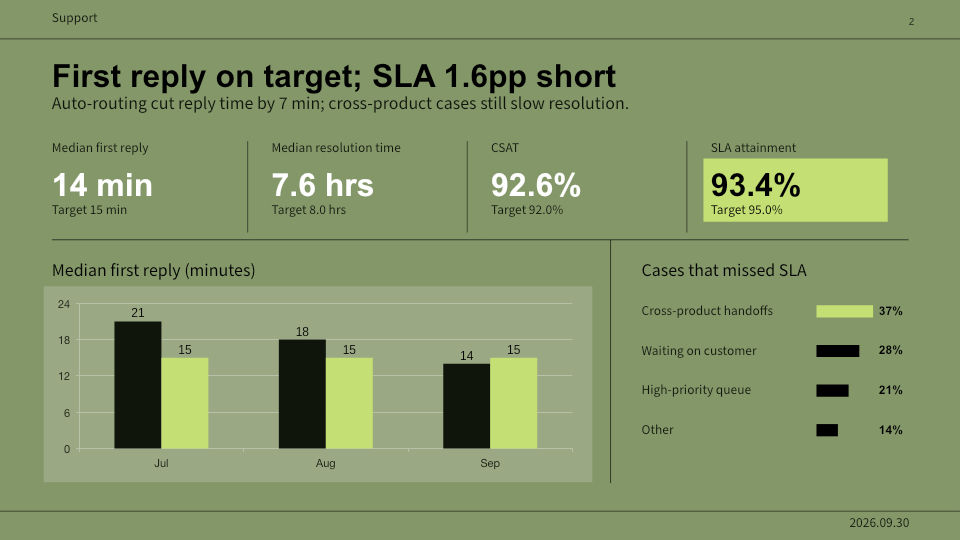
Four KPI cards over a column chart and a bar breakdown
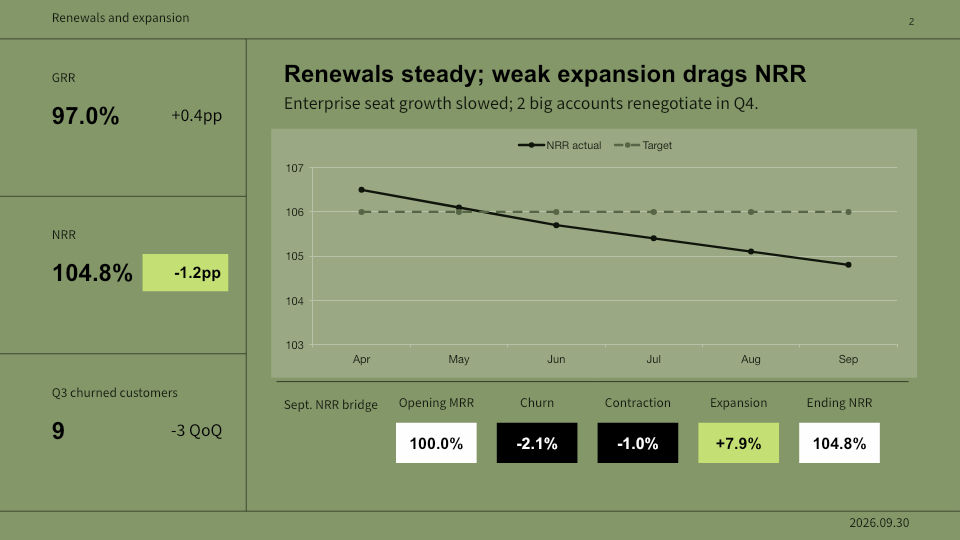
Three KPIs beside a line chart and a value bridge
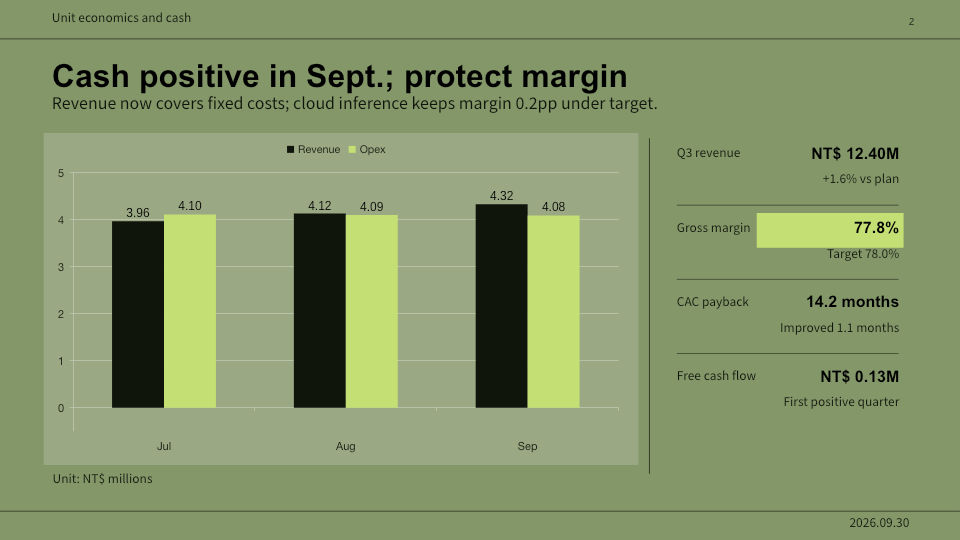
Paired column chart beside four KPI rows
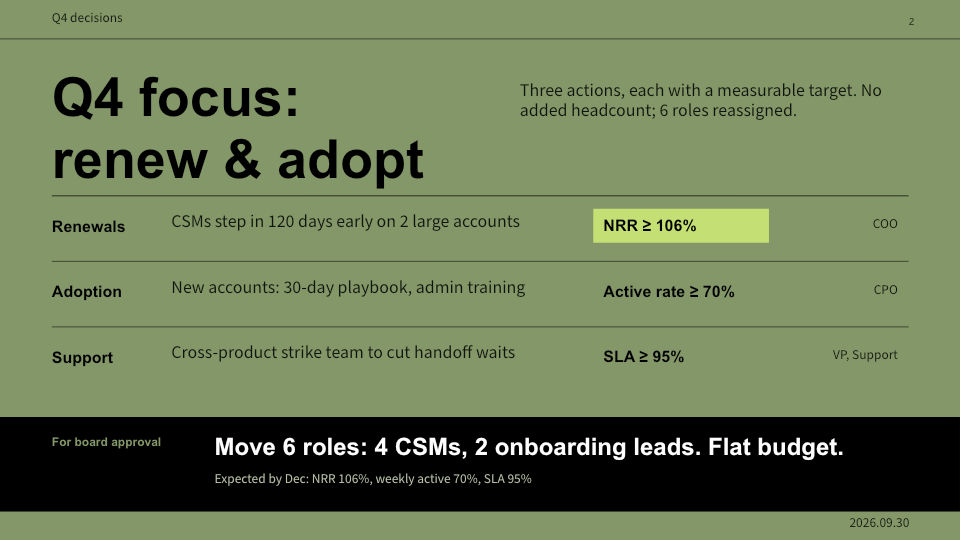
Three action rows (goal, target, owner) over an ask bar